HeronSentry
HeronSentry is a standalone observability plane for AI Agents: capturing runtime events via standard OTLP to deliver call chain traces, cost aggregation, alerts, and performance exports without depending on other suite products.


HeronSentry
Observability PlatformStandalone AI Agent observability plane: tracing, costs, alerts, and performance analysisWhat Agents do, how well they perform, and what they cost—visible at a glance via standard OTLP.
- OTLP
- Open protocol; semantic fields mapped via profiles
- Full Ingestion
- Unsampled by default
- Synchronous Ingest
- Persisted within request lifecycle
- Standalone
- Deployable with zero suite dependencies
Typical pains
- Troubleshooting broken Agent workflows relies on raw logs without distributed call chains
- Costs remain invisible until month-end invoices arrive after budgets are blown
- No visibility into whether specific Agents are healthy or experiencing abuse
Core value
Runtime alerts with optional webhook fan-out
Error rate, cost spikes, ingestion backlog, and high-frequency tool calls can fan out via webhook once an endpoint is configured; latency spikes and orphan spans skip the webhook and stay on the alerts view.
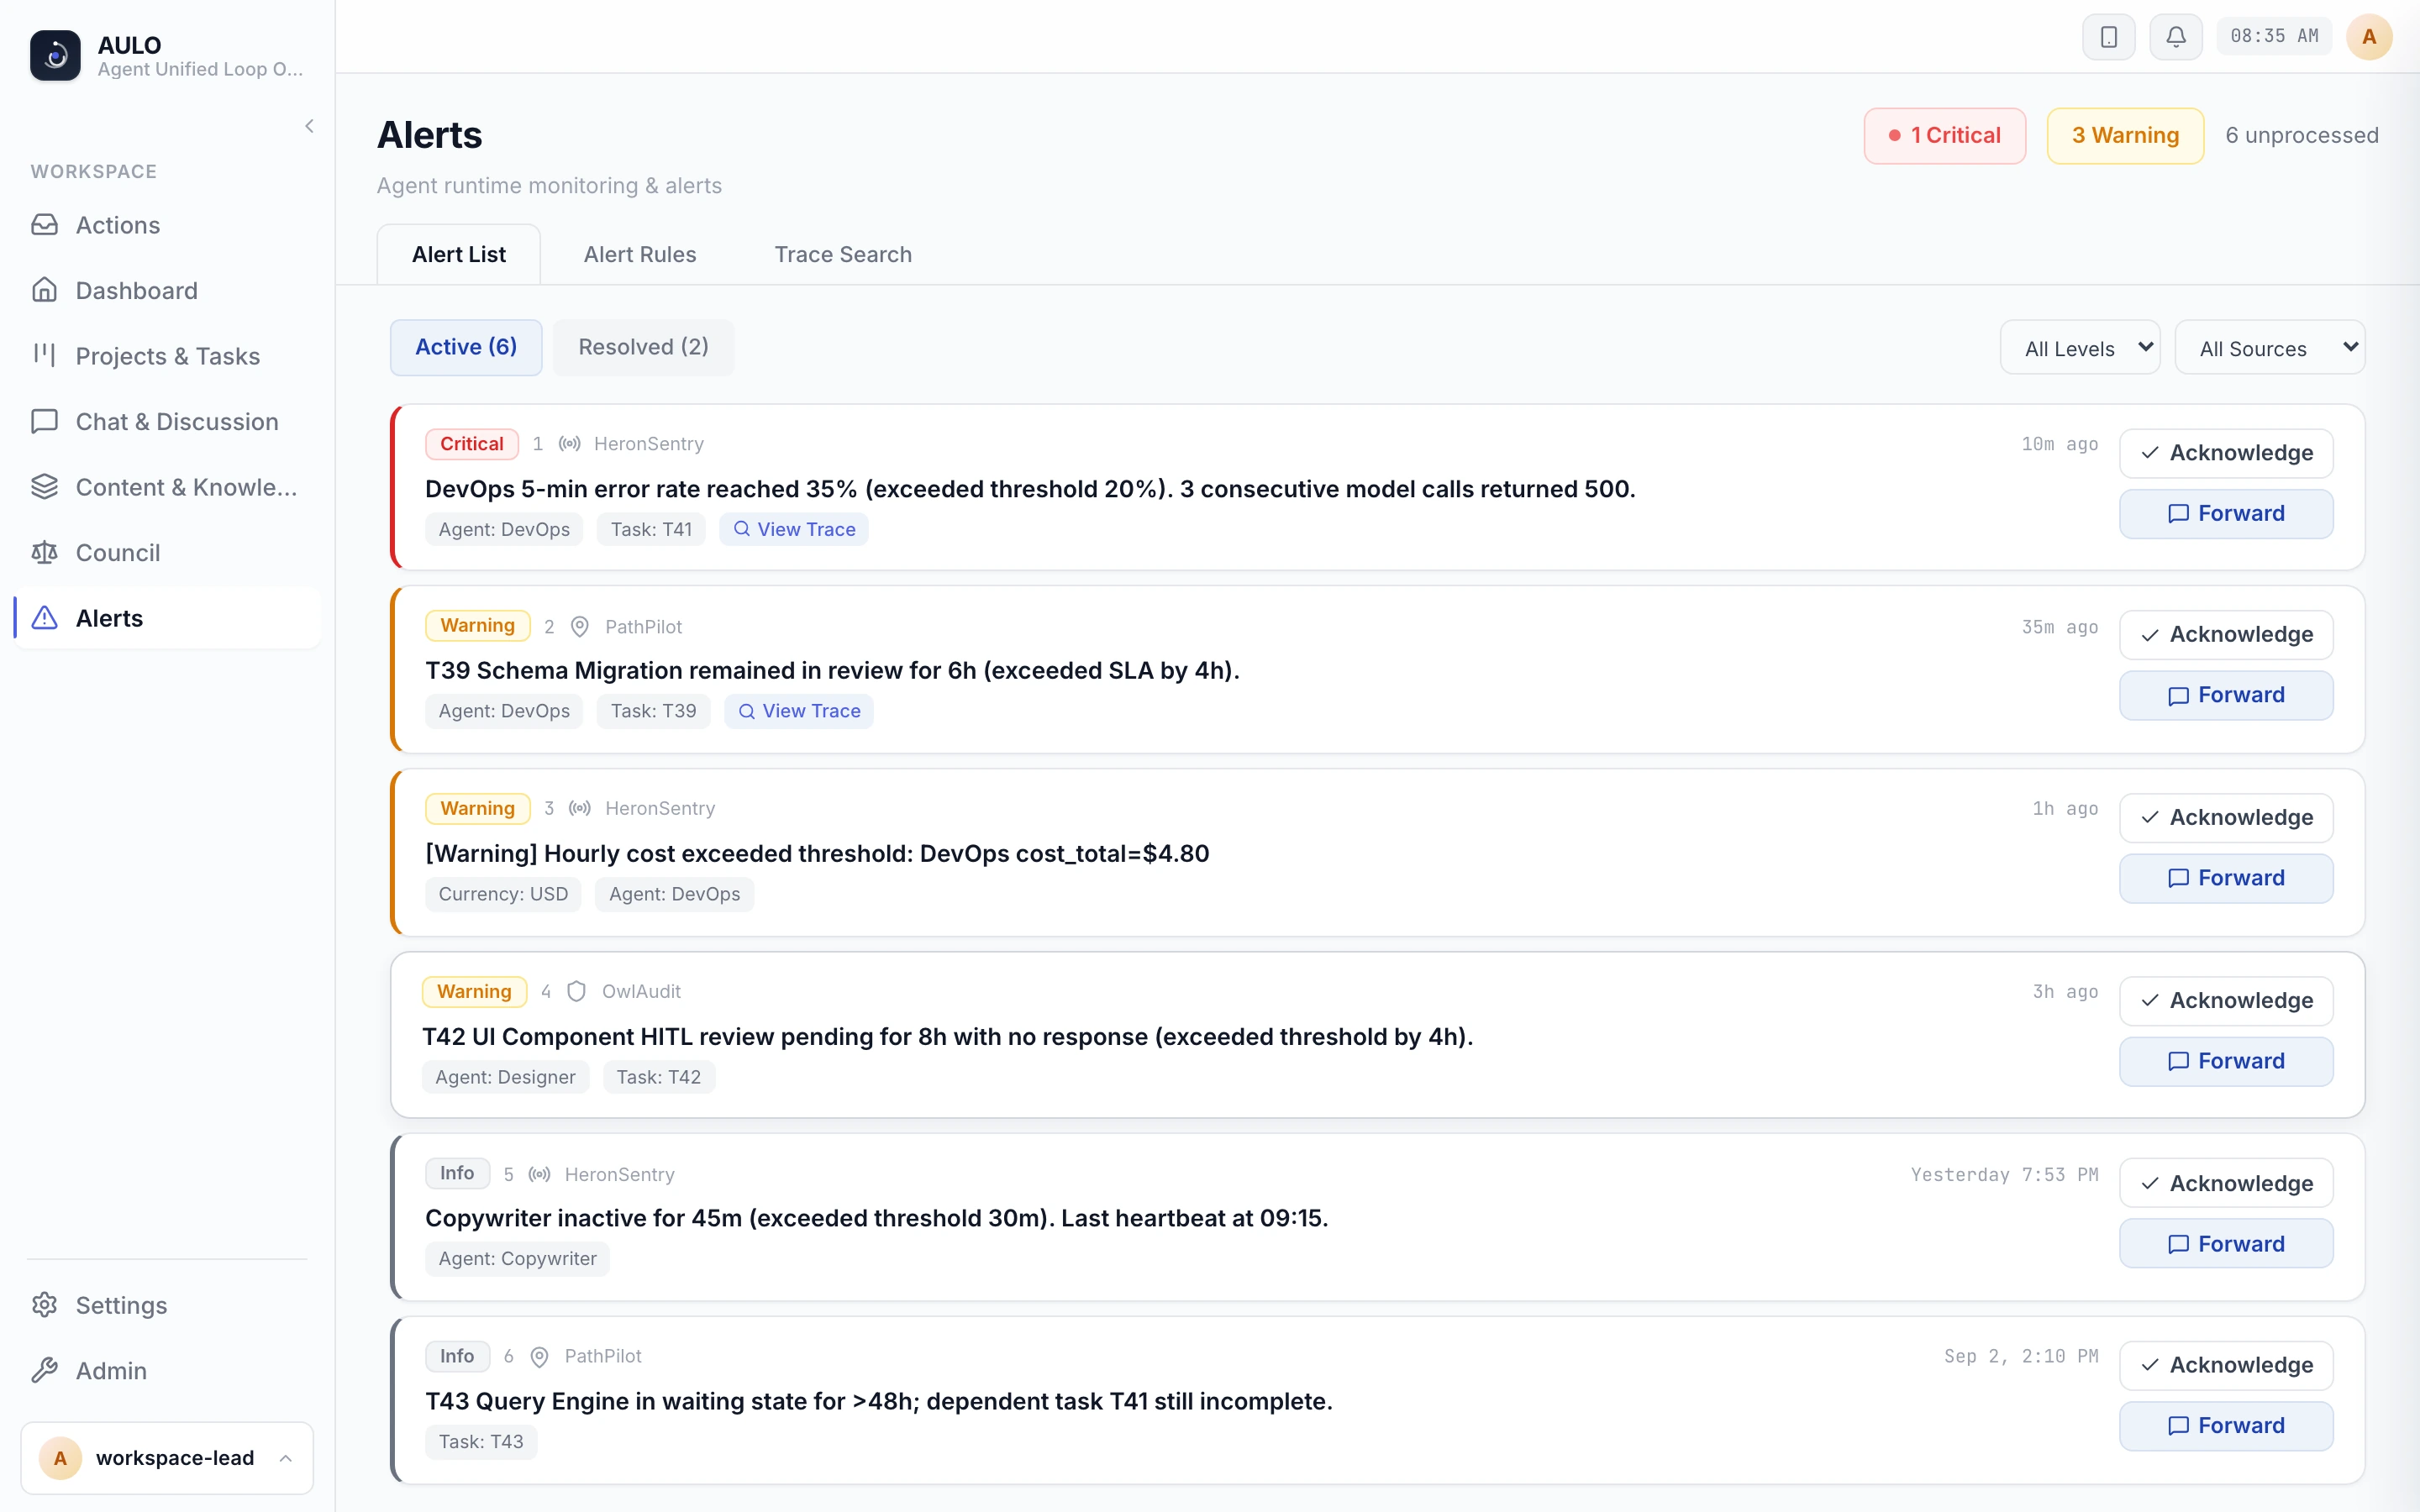
Latency, error rate and truncation for each agent
HeronSentry rolls up response latency, streaming time to first token (TTFT), error rate and truncation rate for each agent, along with the model and provider it used most recently. AULO shows them in the agent detail panel of its console.
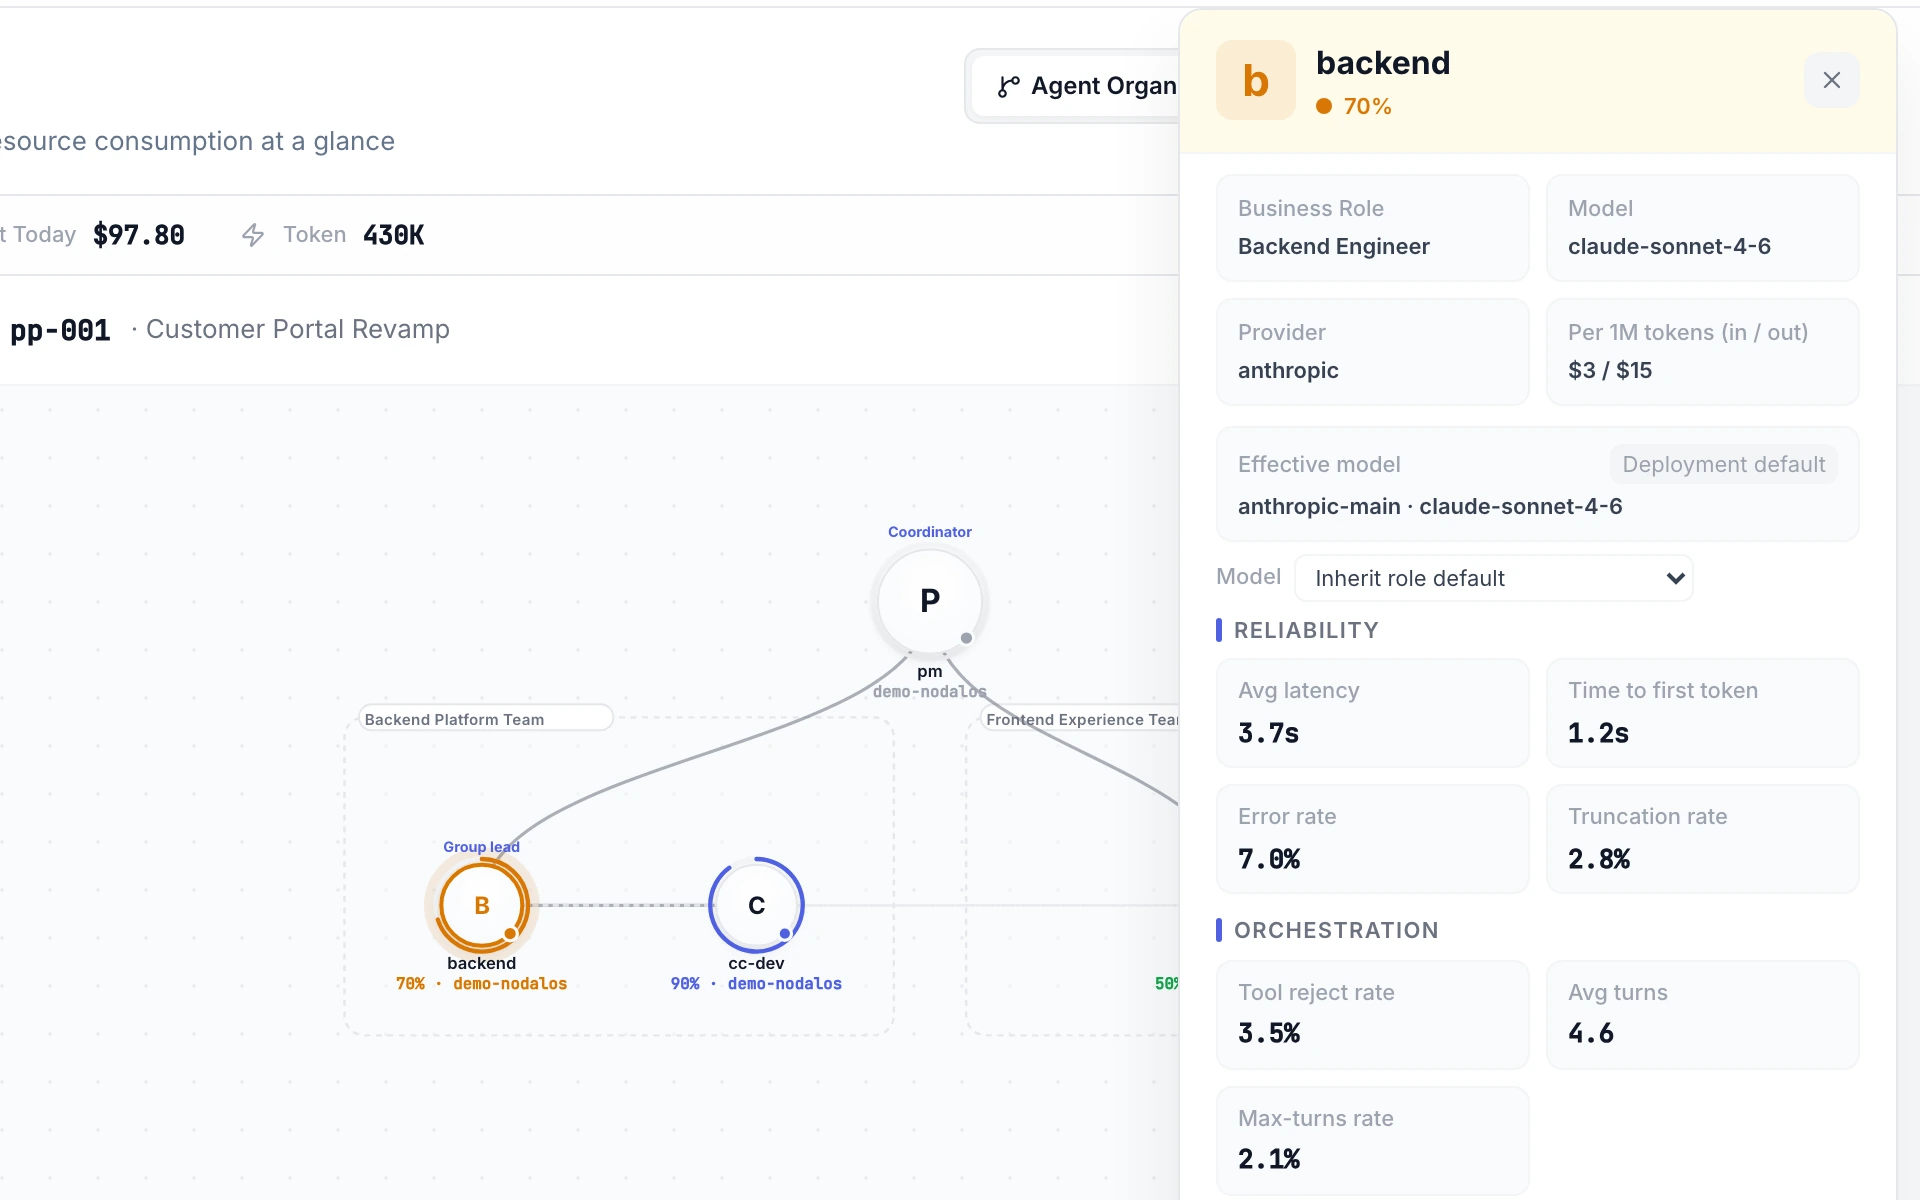
Tokens and spend by model, host and agent
The token usage and spend HeronSentry collects are grouped in AULO's resource overview by model, by host and by agent, so one screen shows which model, and which agent on which machine, uses the most.
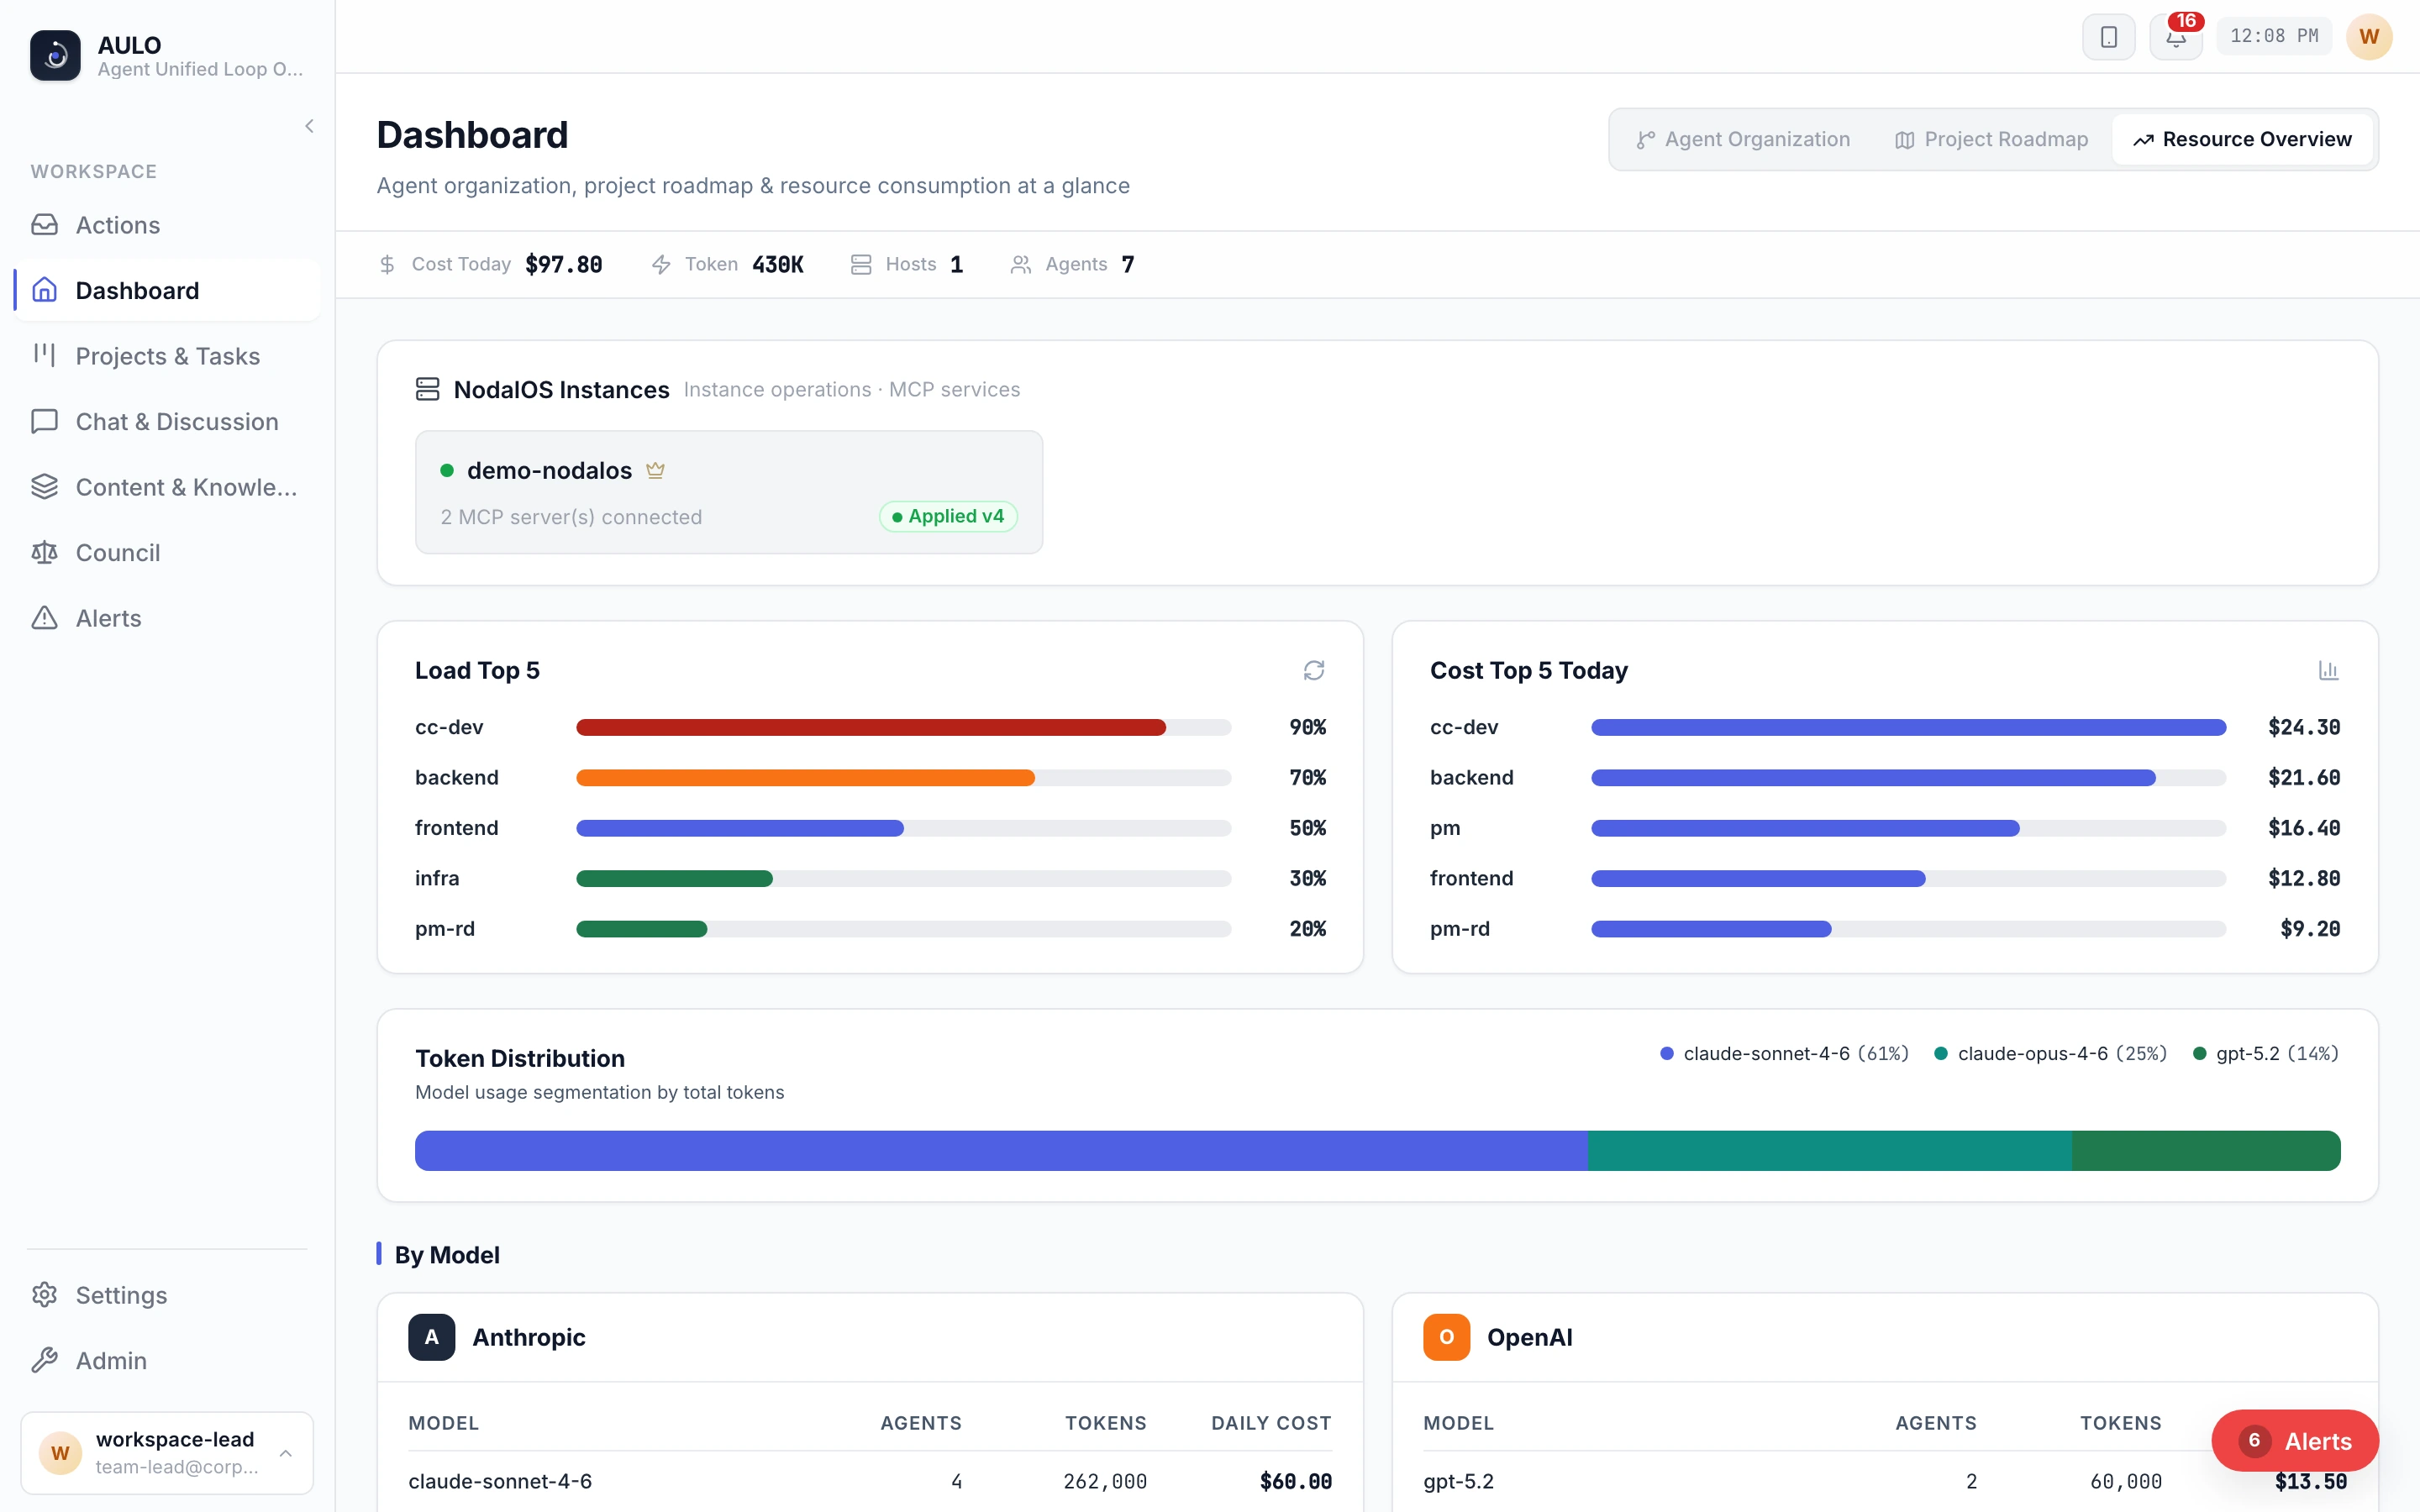
Project spend by model and agent
HeronSentry attributes a project's tokens and spend to each model and each agent, and splits tokens into input, cached and output. Budget utilization comes from PathPilot.
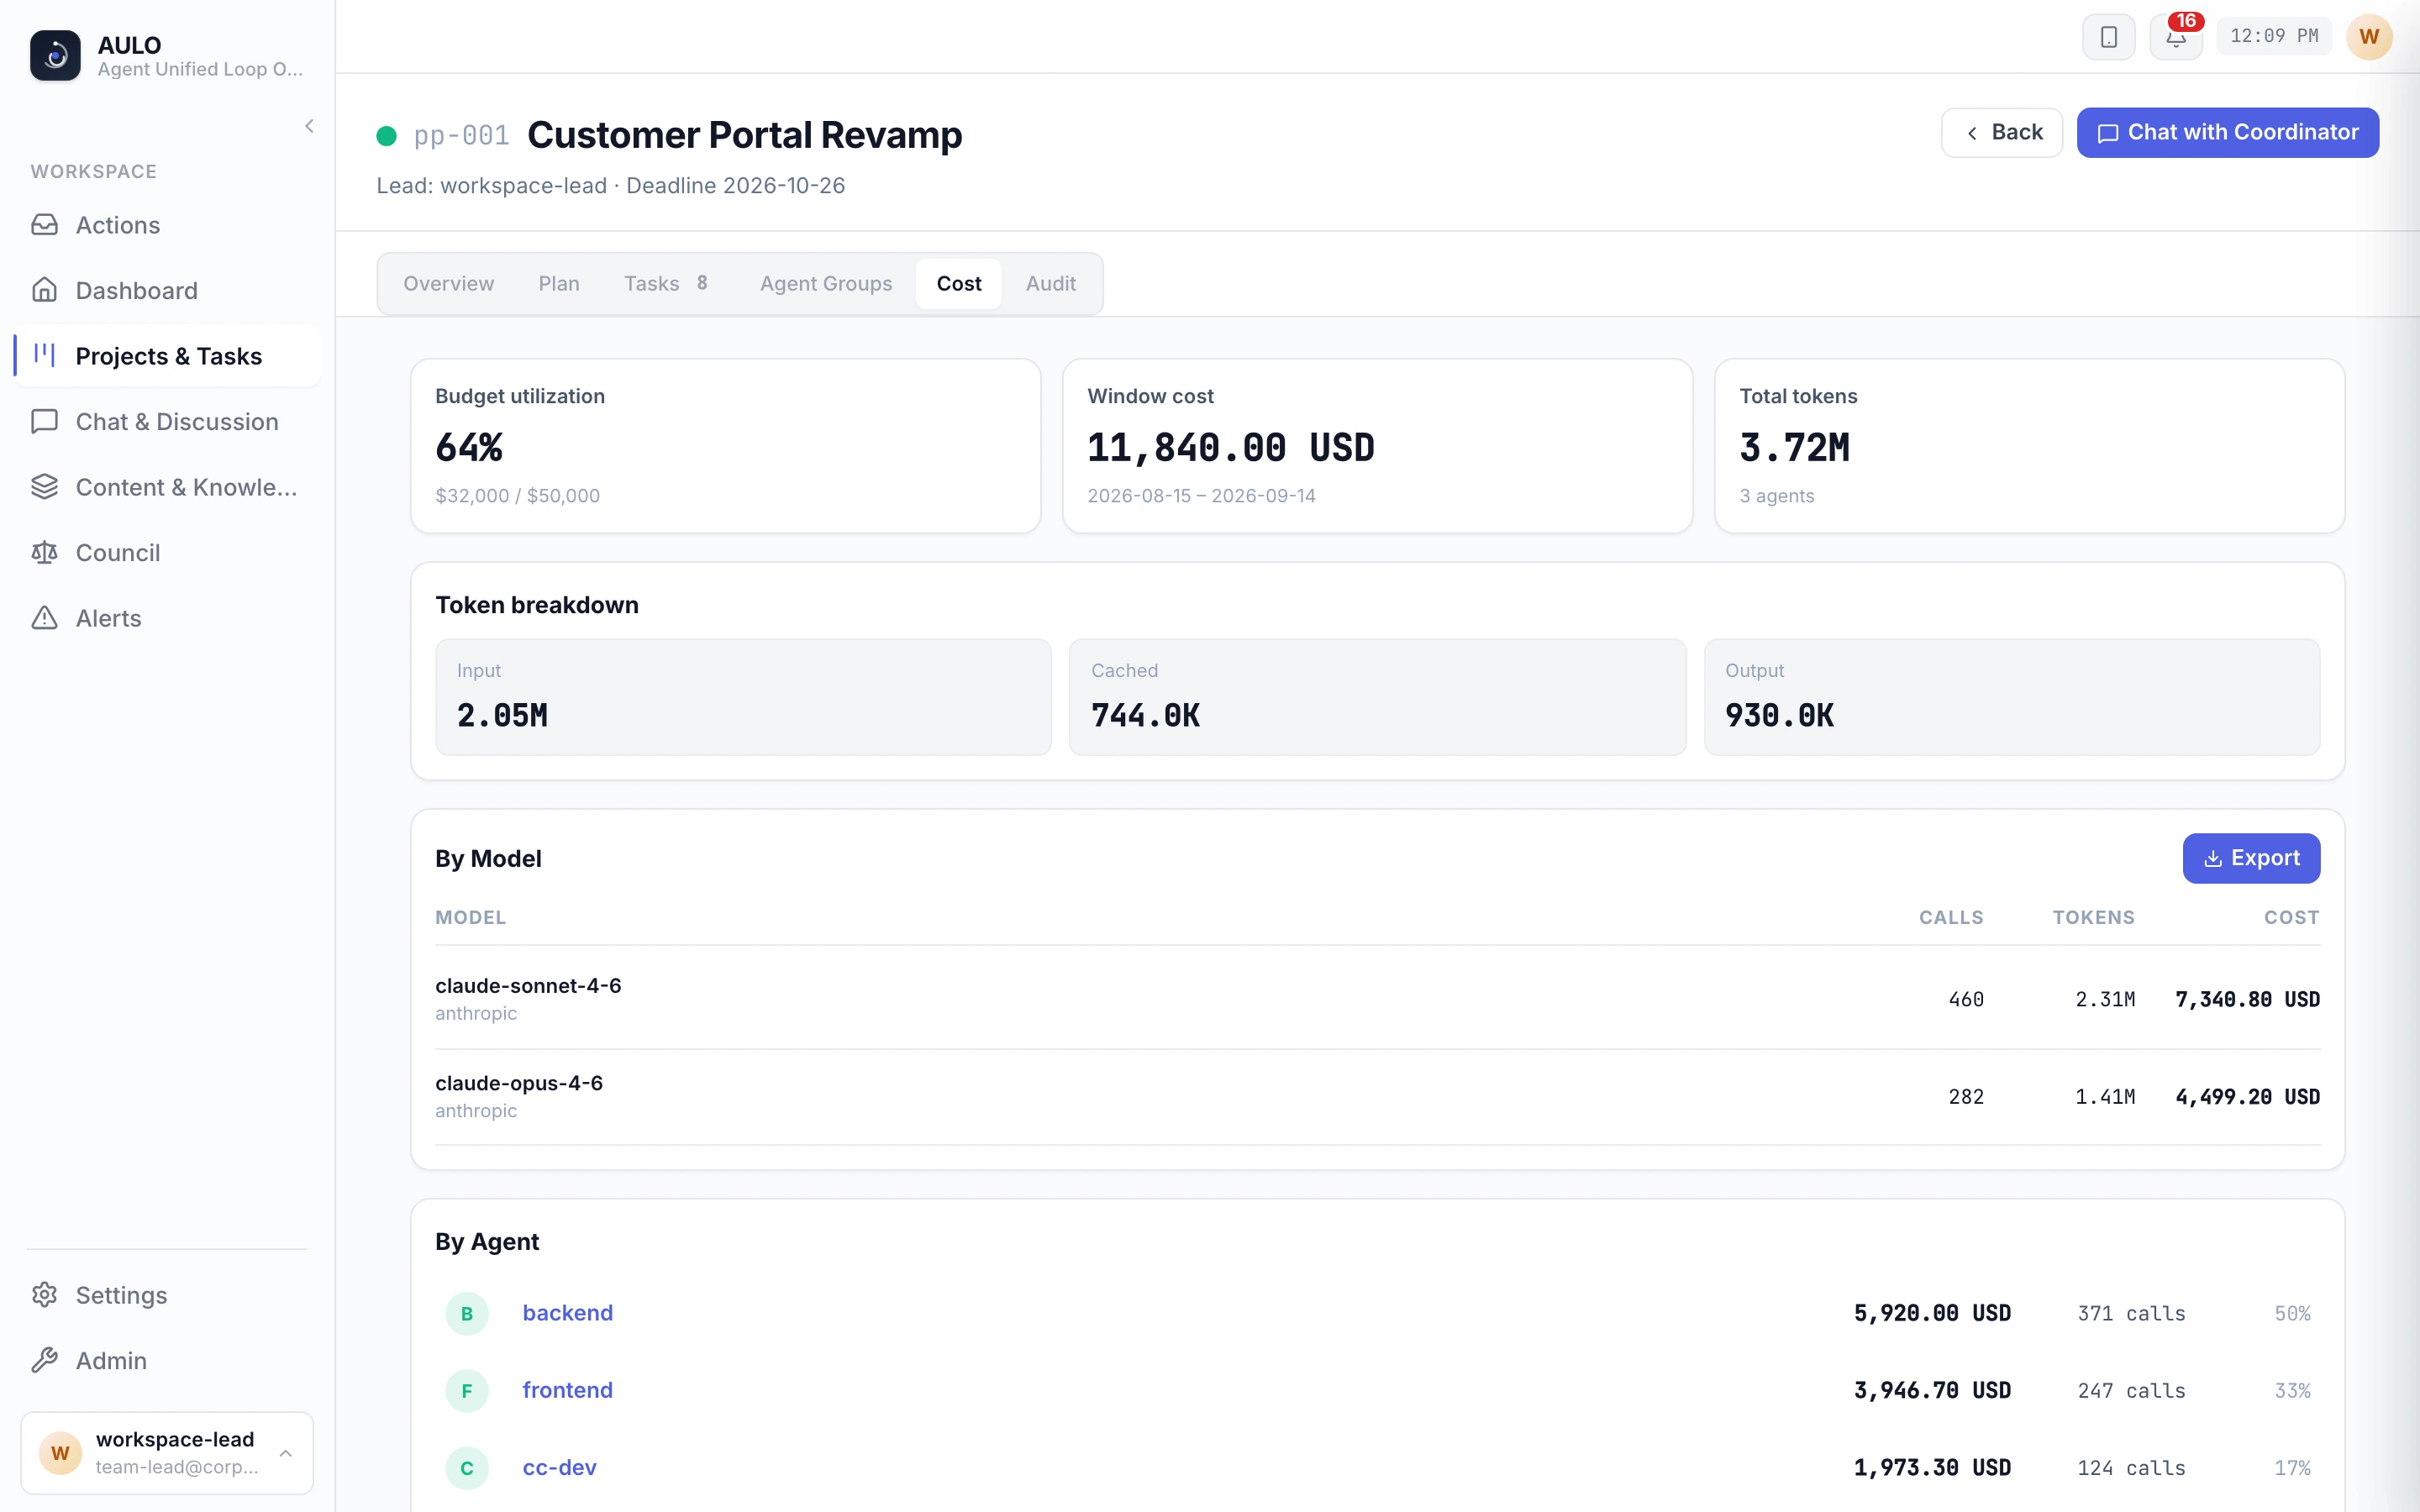
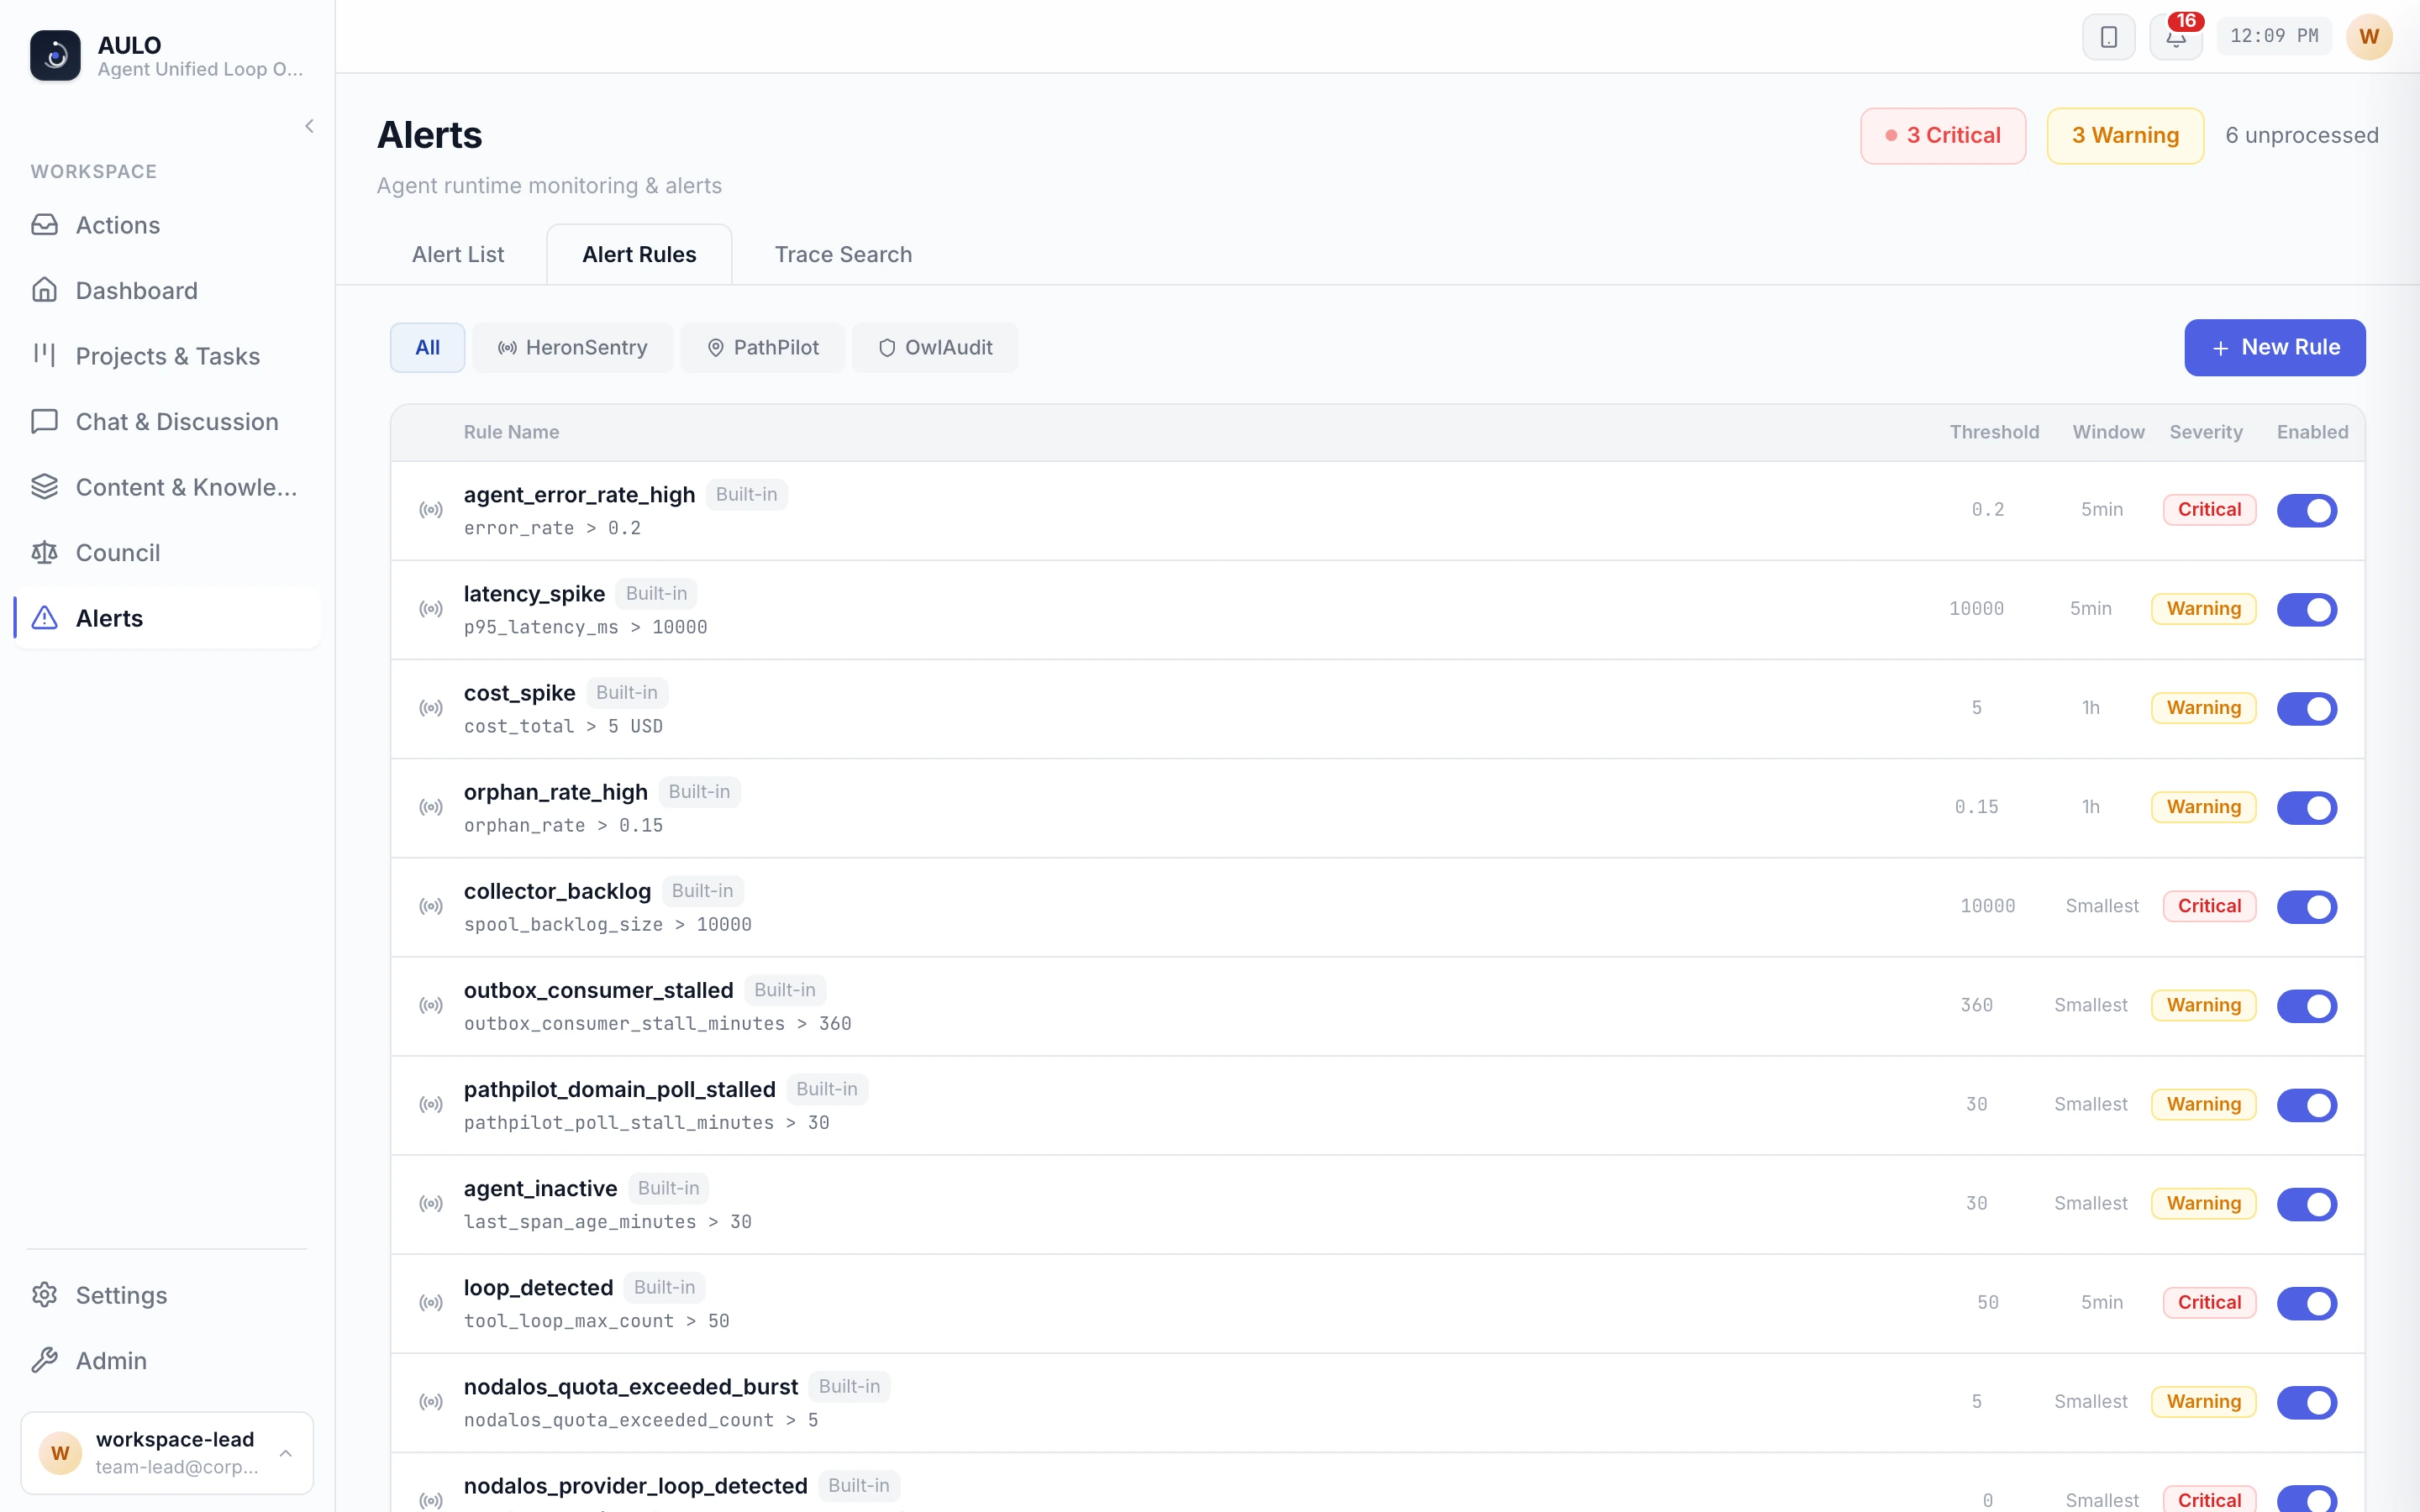
Alert rule thresholds and switches
HeronSentry's alert rules are listed in AULO with their conditions, thresholds and severity. Filter them by source and switch each one on or off.
Capabilities
Ingestion
Tracing & topology
Cost & performance
Alerting
Does / does not
- Standard OTLP ingestion: traces, metrics, and logs persisted in real time
- Distributed call-chain tracing: reconstruct Agent reasoning, tool calls, and model interaction topology
- Granular token and cache cost accounting: split cache read/write for real-time cost attribution
- Multi-dimensional alerting: error rate, cost spikes, backlog, and anomalous calls, with optional webhooks
- Agent reliability metrics: TTFT, truncation rate, and tool-rejection analysis
- Analytics and audit data export: metrics and audit feeds for OwlAudit and operators
- Does not serve as a generic enterprise full-text log search cluster (focuses on Agent-runtime OTLP traces and structured logs)
- Does not replace host/network infrastructure monitoring (focuses on Agent application and model-interaction semantics)
- Does not execute active runtime interventions (read-only observability and alerts; blocking belongs to OwlAudit / NodalOS)
By role
Standard OTLP ingestion avoids framework lock-in; coexists with existing observability stacks without claiming backend reuse
OwlAudit pulls operational telemetry exports from this service
Clear cost attribution and measurable ROI for enterprise Agent deployments